The role of active and passive monitoring in virtual networks

There’s been lots of discussion around the changing role of service monitoring as carrier networks become virtualized. This discussion often centers around the question of active monitoring versus passive monitoring–but this is really the wrong question. It’s not a matter of one versus the other; rather it’s a case of understanding when to use one or the other.
How did we get here?
In a traditional, physical network, routing of services was carefully engineered with the service topology typically mirroring the network topology. Because of this, it was easy to infer service quality from network quality and as a result, many services were simply not monitored at all. However, virtualized networks break this 1:1 relationship, potentially leaving many services essentially invisible to the operations teams. So, the role of service monitoring needs to change from that of a tool for monitoring and policing just the high revenue, SLA (service level agreement) based services, to become, essentially, the ‘eyes and ears’ of the network and service operations teams.
A quick refresher on monitoring
There are two well-accepted methods of monitoring service performance; active and passive, and each comes with its own strengths (see Figure 1: Active versus passive monitoring).
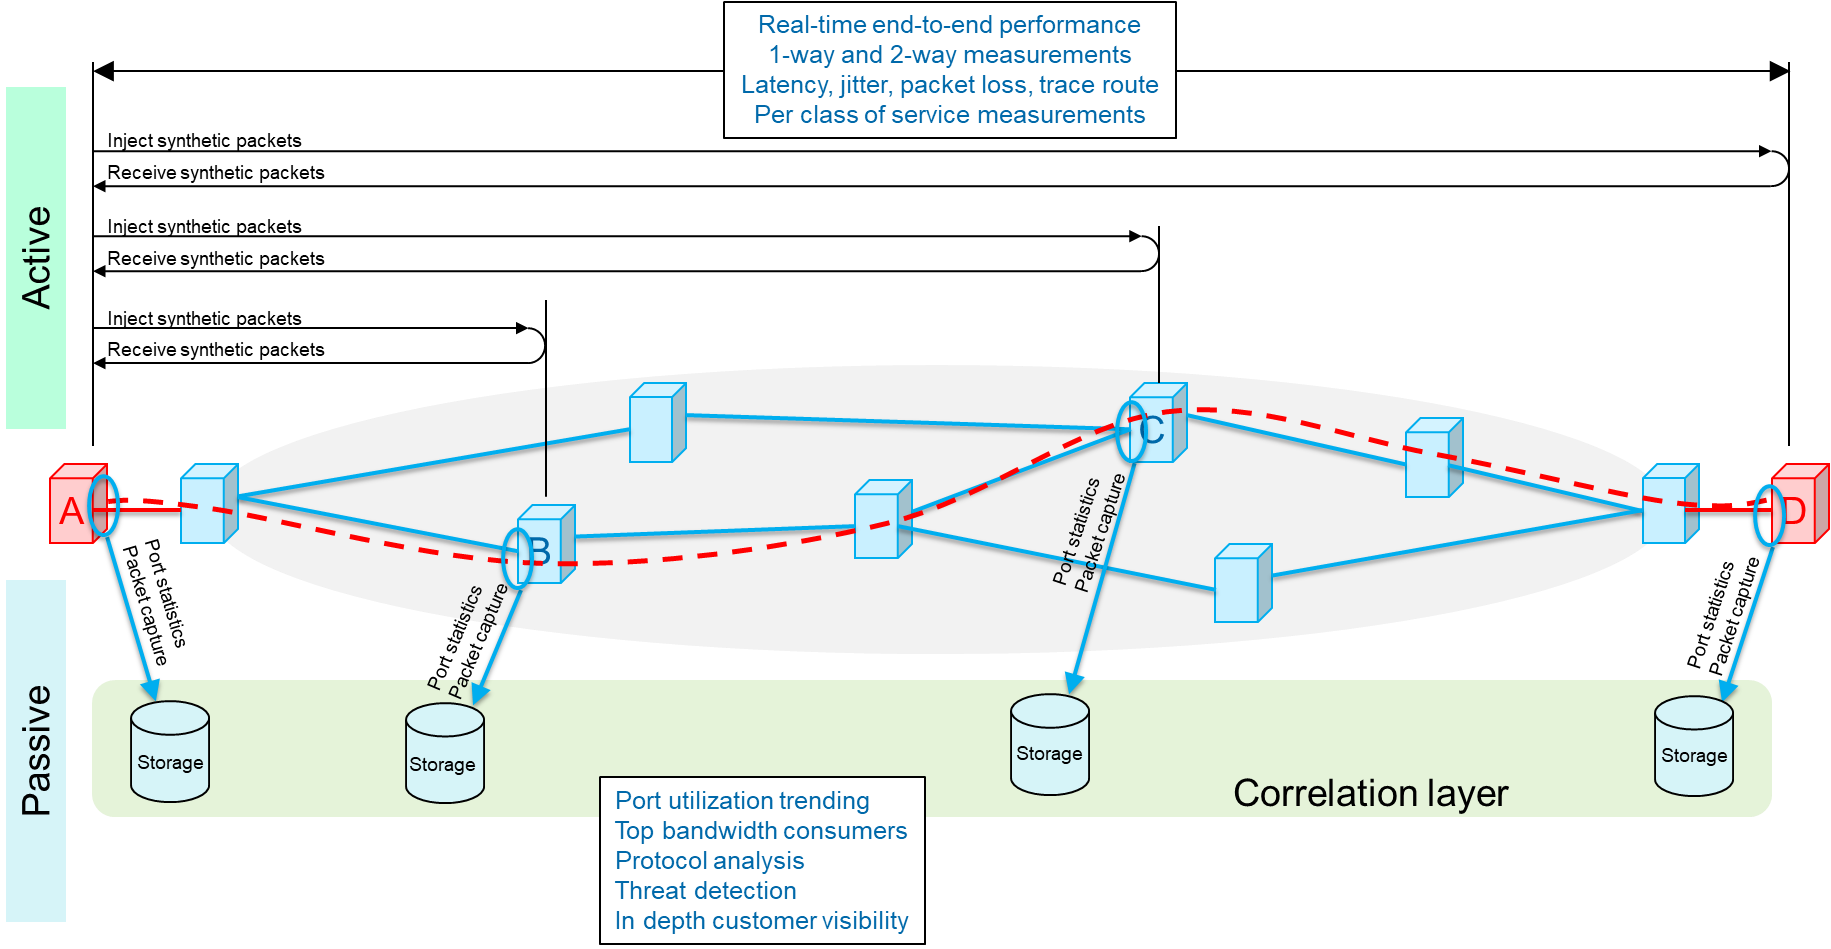
Figure 1: Active versus passive monitoring
Active monitoring: Also known as synthetic monitoring, involves injecting test traffic into the network, typically with the same forwarding criteria as the user traffic (service) being monitored, and then measuring its performance. These tests can either be one-way (from site ‘A’ to site ‘D’ or round trip (from site ‘A’ to site ‘D’ and back to site ‘A’), depending on what you want to measure. Since test traffic mimics the service traffic, active testing is ideal for providing a real-time view of the end-to-end performance of a service with regards to such things as latency (or delay), jitter (or delay variation), or packet loss. It’s worth noting that active testing can be performed between any 2 sites along the service path, for example, from site ‘A’ to site ‘B’ or site ’A’ to site ‘C’. This means that, with some simple math, it’s possible to segment the overall end-to-end path so that performance indicators can be derived on a per segment basis, providing greater, real-time visibility into where issues might be located.
Active monitoring is the primary method for policing SLAs, since it provides a real-time view of performance.
Passive monitoring: This technique involves capturing and analyzing live network traffic, or traffic statistics, at a specific point in the network – for example, the network interface to an application server. As its name suggests, passive monitoring does not require another site in the network to be involved, or even aware. At its simplest, passive monitoring may be nothing more than the periodic collecting of port statistics, like byte and packet transmit and receive numbers. More typically, it also involves capturing some, or all, of the traffic flowing through a port for detailed, non-real-time, analysis of things like signaling protocols, application usage or top bandwidth consumers.
Passive monitoring is ideally suited for in depth traffic and protocol analysis, especially in a ‘post-event’ scenario such as root cause analysis. It’s also well suited to gaining in depth visibility into the customers quality of experience (QoE).
The best of both worlds
Getting back to the question at hand, in a virtual or hybrid network, both active and passive monitoring are necessary to get the full picture.
Active monitoring should be used to provide real-time visibility into service level performance, or quality of service (QoS). Used in this way, it can provide an early warning of performance degradations, potentially even before the customer notices. And by having this level of visibility on most, if not all services in the network gives automated troubleshooting tools the ability to quickly triage impacted services and identify hotspots or common cause elements to ensure the most critical issues are addressed first.
Passive monitoring can be used to support two key operations functions. First, it should be used for post event analysis, such as root cause determination or malicious traffic identification. By building a historical profile of traffic flows and signaling, analysis can be carried out to look for anomalous traffic, such as distributed denial of service attacks, or unusual or indicative signaling, like excess call drops or high retransmission activity. Secondly, passive monitoring is ideal for building a detailed understanding of customer usage patterns and application performance, allowing carriers to directly monitor quality of experience (QoE). Detailed information from this aspect provides a wealth of information to create customized service bundles based on usage preferences, plan network and system upgrades to match demand growth and identify opportunities for new services.
Summary
Both active and passive monitoring are essential tools for building and maintaining a competitive advantage in virtual networks. Virtualization, through its use of whitebox appliances, virtual network functions (VNFs) and open service models and APIs, has become the great ‘democratizer’ of networks and CSPs must now focus on metrics like QoE and customer satisfaction as true differentiators.
Active monitoring allows the carrier to be highly proactive in dealing with potential customer service issues, reducing or even eliminating customer outages. Passive monitoring enables a deep understanding of root cause issues and customer behavior, allowing greater visibility into the customer experience.
| Active monitoring | Passive monitoring |
|---|---|
|
|
Seeing the big picture: For both active and passive monitoring to be able to see the end-to-end, big picture, synchronization of time-of-day is essential.
For active monitoring, especially one-way measurements, both ends of the test traffic must have the same time reference so that latency measurements can be calculated accurately. However, because of the real-time, flow-based nature of this monitoring method, there is no need for additional correlation across other network elements as the packet flow essentially takes care of this.
For passive monitoring, however, synchronization is absolutely needed when trying to correlate observations at different locations in the network. Without a consistent and accurate view of time, it would be impossible to associate observations at different points in the network.
Synchronization is essential for accurate monitoring. And whether it’s distributed using satellite-based time distribution; packet-based time distribution; proprietary methods like EXFO’s Universal Virtual Sync; or very stable, inbuilding clocks, doesn’t really change this fact. And as manual, event driven network operations give way to automated, data-driven operations–grounded in machine learning, analytics and artificial intelligence–synchronization becomes even more important. The continuous generation and storing of active and passive monitoring results creates the very large data-lakes of correlated performance indicators and test results needed to drive these systems, all of which would not work without synchronization.