Reducing FTTH OPEX with the Intelligent Optical Link Mapper (iOLM)
Just five years ago, CAPEX reduction was the lingering thought in every telco’s mind. Now, with no end in sight to the increase in bandwidth demand, operators must radically boost network capacity, while pursuing the equally vital objective of cutting back on OPEX.
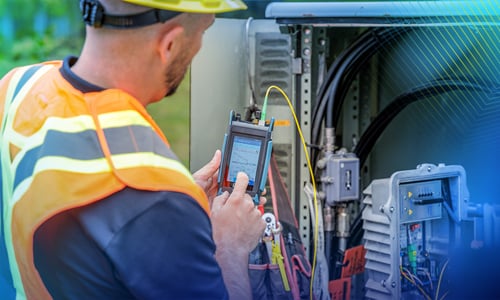
Since bandwidth demand is growing much faster than revenues, service providers have no choice but to massively and rapidly shift toward FTTH deployments and hire numerous new technicians, many of which are migrating from a copper background to fiber-plant testing. These moves can initially be costly for two main reasons. First, former copper technicians generally lack fiber-testing knowledge, which increases training time. And second, there are fewer experienced technicians who can efficiently test and troubleshoot fiber. With the number of fibers to be tested, chances are that some will be misdiagnosed or wrongly characterized, leading to turn-up and troubleshooting failures, and ultimately additional truck rolls—which have a nagging, upward effect on OPEX.
Solving These Conflicting Challenges
Although the above-mentioned challenges are not avoidable, their OPEX repercussions might very well be. To help providers efficiently address the lack of experience and the unnecessary truck rolls, Link-Aware™ technology was developed and built into a newly available solution, the intelligent Optical Link Mapper (iOLM). This completely automated technology uses advanced algorithms, ensuring that all elements of a link are fully and accurately characterized with the end result of enabling operators to avoid costly turn-up and troubleshooting missteps, future-proof their networks and reduce their OPEX.
Two Traditional Test Methods: OLTS and OTDR
There are two main methods traditionally commonly used for testing FTTH networks, both of which have their pros and cons. The first, based on the optical loss test set (OLTS), is very user-friendly, delivering fast and straightforward loss, ORL and continuity measurement results at the touch of one button. However, the OLTS approach requires two technicians, one of which must have some experience in identifying potential problems such as macrobends on a link. In addition, should a problem be detected, a more experienced technician must be called upon to locate and fix the faults (with an OTDR).
The second method uses the optical time-domain reflectometer (OTDR) to perform a single-ended measurement with only one technician. In addition to delivering the same information as an OLTS, the OTDR has the capability to characterize each event. In other words, any fault detected—bad connector, bad splice, macrobend, etc.—can easily be located and qualified. The OTDR’s downside? The skill set required to operate it. In fact, the technician operating the unit makes a huge difference, as the interpretation of traces and test results depends entirely on the user’s experience and ability to select the proper test parameters.
Only expert technicians can execute all the OTDR test tasks accurately, and it can take years to reach that status—which is a major issue in the current context of massive FTTH deployments.
To make things even worse, FTTH is the most challenging type of link to test with an OTDR. Detecting and measuring closely spaced events and short fibers spans on the ONT side (drop fiber) while measuring large localized loss caused by splitters is a difficult task. There is no optimal pulse to extract all the information from an FTTH link. Running a quick test with an OTDR only gets a fraction of the available information.
Therefore, the only way to obtain the full information is to perform several OTDR measurements with different OTDR pulses. Failure to do so can lead to incomplete network characterization, several problems going unnoticed, and ultimately to repeat truck rolls.
Testing an FTTH Link with an OTDR
Recently, EXFO surveyed 10 companies involved in fiber-optic deployments. Results show that those companies have an average of 5% to 10% of repeat truck rolls mainly due to fiber mischaracterization or lack of a diagnosis. Repeat truck rolls can be minimized when testing is optimized. In theory, this can be achieved by assigning an experienced technician to the task. Below is a typical example of such a situation.
The technician starts by using a short pulse width to qualify the first part of the link, probably up to the splitter, to make sure that the front-end connector and the drop fiber meet predefined specifications and that all splices are within acceptable limits.

Figure 1. Using a 5 ns to 10 ns pulse width, an experienced technician verifies the first connector and identifies all elements on a link, up to the splitter; using OTDR technology enables better resolution and easy pinpointing of a problematic connector splice.
Then, using a second acquisition with a longer pulse width, the technician measures loss at the splitter to verify if it is within acceptable limits.

Figure 2. Using a longer pulse width than for the first trace, an experienced technician qualifies the splitter area, and possibly the portion between two splitters. Depending on the results, the technician may need to repeat this second step to find the optimal pulse for measuring the splitter loss.
Finally, the technician completes the test with a pulse width that has enough dynamic range to allow end-to-end loss qualification.

Figure 3. Using a pulse width with enough dynamic range, an experienced technician can measure the end-to-end loss.
This process results in having three or four OTDR traces that are not consolidated. A fair amount of time will be spent comparing results at the different pulse widths to determine which one provides the best measurement for each section and event. Plus, if a single report must be provided at the end, extra time will also be required to extract information from the different traces and input the data into a custom report template. Overall, the entire process could take between 5 to 10 minutes, depending on the complexity of the network and the documentation required.
To detect macrobends, this long sequence must even be performed another time at a second wavelength (e.g., 1310 nm and 1550 nm) to compare the loss of each event between both wavelengths.
To fully characterize an FTTH network, one must therefore analyze information gathered from many traces. But the reality is that no one has both the time and the experienced technician available to test this way.
The Forward-Thinking Alternative: the iOLM
The very accurate, yet time-consuming and highly complex OTDR test procedure can now be performed automatically with the intelligent Optical Link Mapper (iOLM). This revolutionary solution employs different pulse widths to fully characterize all sections of an FTTH network—each section being characterized with the optimal pulse. Then, the iOLM consolidates all this information into a single comprehensive Link View; the operator no longer has to compare results at different pulses.
The iOLM provides the loss and ORL of a link, in addition to identifying all network elements such as splices, splitters and connectors. It offers the loss and reflectance of the identified elements. And when a specific element or the link itself gets a “fail” verdict, it offers a diagnosis to help the operator solve the problem. The whole routine takes 30 to 60 seconds, depending on network complexity.

Link View represents each element by a distinct pictogram, helping the technician to immediately identify all the elements in the link. Viewing and correcting a problem becomes very easy, as even an entry-level technician with minimal experience in optics will be able to perform tests just like any other experienced technician, and will do so in less time. Training time is minimized and network quality is increased, thus improving the end customer’s quality of experience (QoE). The iOLM also saves all results in a comprehensive report that can easily be transferred to a database.
Business Case
Consider a typical business case, with a team of 20 technicians working three jobs per day and 200 days per year, for a total of 12 000 jobs per year. According to the previously mentioned survey, the average yearly percentage of repeat truck rolls ranges between 5% and 10%, which means 600 to 1200 jobs in this particular example. Repeat truck rolls represent the number of times a truck is sent back to fix problems for varying reasons: lack of technician training, wrong pass/fail criteria, wrong equipment usage, false diagnosis, wrong OTDR trace interpretation (bad splice or connector), turn-up failure troubleshooting, etc.
Based on the same survey, the average cost of a truck roll is between $100 and $150 per hour, excluding manpower. The average salary of the experienced technician can amount to $40 or $50 per hour, and an average of two to three hours is required to do the repair. Overall, such repeat truck rolls can cost between $168 000 and $720 000 per year.
With its intuitiveness and advanced analysis technology, the iOLM can truly help in that regard, since a) it allows network operators to assign their experienced technicians to more profitable tasks, and b) it eliminates the vast majority of analysis mistakes, therefore minimizing repeat truck rolls and their related costs.
For example, based on the same survey, an entry-level technician earns $20 to $40 less per hour than an experienced technician. In a typical year (200 working days of eight hours each), such a difference would represent OPEX savings of $32 000 to $64 000 per technician, per year. For the same team of 20 technicians, it would amount to $640 000 to $1 280 000 per year.
Conclusion
A lot has been done in the last few years to streamline the CAPEX part of networking business. Now, the current market imperatives—booming bandwidth demand combined with flattening revenues—are creating an OPEX challenge that is leaving operators looking for answers. By enabling entry-level technicians to fully characterize a link with a simple one-touch operation, without having to combine, analyze or interpret multiple, complex OTDR traces, the iOLM might just be one of those answers.