How to capitalize on the existing fiber network’s potential with an optical spectrum analyzer
Optical spectrum analyzers (OSAs) were initially introduced to measure the optical power of a signal as a function of wavelength or frequency. They gained popularity with the introduction of wavelength division multiplexing (WDM), since standard power meters cannot discriminate between several wavelengths. However, despite the fact that most people are familiar with the typical applications of OSAs for troubleshooting a network or measuring the channel power and noise level, for a number of reasons, these unique measurement devices have not been widely accepted on the market. One such reason is that the true power of an OSA is, to a certain extent, underestimated, particularly when trying to maximize the potential of a fiber span.
This article introduces the concept of optical signal-to-noise ratio (OSNR) and its importance, as well as the consequences of poor OSNR on a network, examines the current perception of OSAs in the marketplace, and finally shows how an OSA can be used to fully exploit a fiber link.
Optical Signal-to-Noise Ratio
The concept of OSNR is key in the characterization of a WDM network. It is a quantitative measurement of how much the signal has been corrupted by noise, during the propagation in a fiber. It is computed by dividing the total signal power by the noise power in a 0.1 nm bandwidth. Figure 1 shows a typical signal measured by an OSA that has a power of about -22 dBm with a noise floor of around -46 dBm; therefore, we have about 24 dB of OSNR in this example.
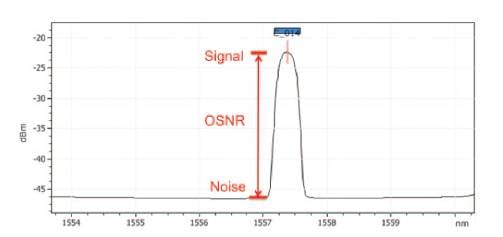
Figure 1. Example of optical signal-to-noise ratio (OSNR).
Importance of OSNR
Why is it important to measure OSNR? There exists a direct relationship between OSNR and bit error rate (BER), where BER is the ultimate value to measure the quality of a transmission. As detailed in figure 2, higher OSNR translates into a lower bit error rate, which equals fewer errors in transmission. Conversely, a low (or poor) OSNR can have a detrimental impact on the number of truck rolls, the quality of service (QoS), etc. (see figure 3).

Figure 2. Relationship between OSNR, BER and QoS.
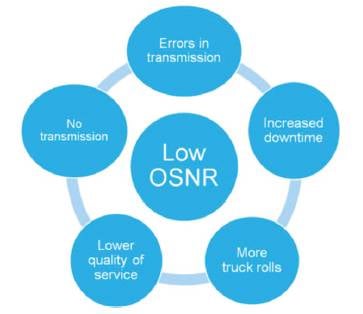
Figure 3. Impacts of low (or poor) OSNR.
OSNR in a Network
It is interesting to examine the change in OSNR as the signal propagates through the fiber. Figure 4 presents a typical network implementation that consists of eight wavelengths multiplexed on a single fiber. (Note that four erbium-doped fiber amplifiers (EDFAs) are used to boost the signal power along the propagation path.) As illustrated, each EDFA amplifies the signal and the noise already present, and it also adds its own noise contribution. As a consequence, OSNR degrades as the signal successively travels through the amplifiers. Due to its variation with distance, OSNR is often monitored at different locations in a network, and not just at the transmitter end or the receiver end.
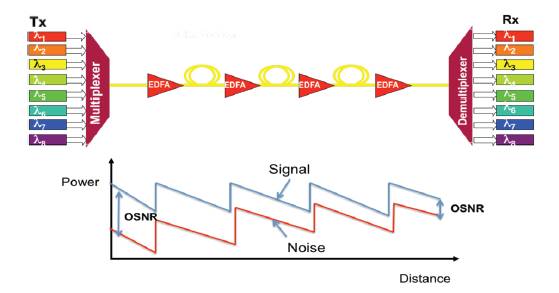
Figure 4. Evolution of OSNR with propagation in a fiber.
Origin of Noise in a Network
EDFAs are the main noise contributors in a network, as a result of a process called “amplified spontaneous emission” (ASE). A typical EDFA contains a laser (called the “pump”) that excites the erbium ions from the ground state L1 to level L3 (see figure 5) if it operates at 980 nm, and from L1 to L2, if it operates at 1480 nm. The ions at L3 will decay very fast to L2. If a signal at 1550 nm is present in the fiber, the signal photons will stimulate an ion from state L2 to decay to L1, thus generating another photon that has the same wavelength and direction of propagation as the signal photon. The signal will therefore be amplified through stimulated emission. The erbium ions can also decay from level L2 to L1 by spontaneous emission, which occurs at random and produce photons. Those photons can then interact with other erbium ions and can be amplified, resulting in ASE, i.e., noise. Accordingly, each EDFA, due to its ASE, will reduce the amplified signal’s OSNR. If the signal successively goes through several EDFAs, the first EDFA will typically decrease the OSNR by about 3 dB, while the following EDFAs will reduce the OSNR by less than 3 dB.
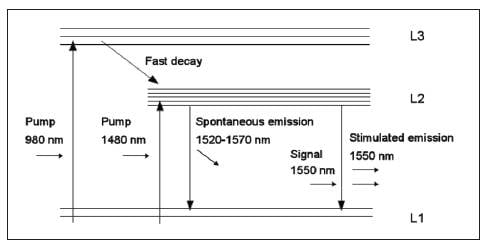
Figure 5. Spontaneous and simulated emission in an EDFA.
Current Perception of an OSA in the Marketplace
In a typical activation and commissioning procedure, a field technician might first use a fiber probe to make sure that the connectors are clean, and then test the loss in the fiber with a power meter. If the loss is greater than the pass value, the field technician will use an optical time domain reflectometer (OTDR) to locate the fault, and the testing sequence will usually end with a BER test. Next, the turn-up team will turn the transmitters on and perform an OSA measurement to check the central wavelength and the power level of each channel and OSNR, in some cases. In this instance, the OSA measurement can be perceived as an extra and useless measurement in a long checklist of tests to carry out. In fact, this false assumption disregards the true value of an OSA to fully exploit a fiber network.
How to Maximize a Network’s Potential with an OSA
In addition to confirming whether a minimum set of criteria is met for network performance assessment (channel flatness, minimum power, etc.), an OSA is one of the few measurement tools that allows to reach the fill potential of a network. There are three things that can be done to optimize network performance with an OSA: increase the number of channels; increase the data rate, and test different network configurations in a laboratory.
By measuring OSNR, channel spacing and signal spectral width, an OSA allows a network planner to determine whether it is possible to increase the number of channels (figure 6). Assuming that network elements can handle tighter channel spacing (considering, for example, mux/demux), adding extra channels can easily increase the bandwidth of a fiber span.
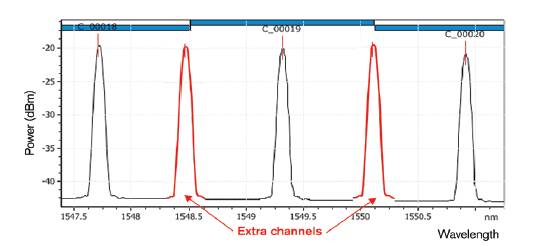
Figure 6. Using an OSA to determine if the number of channels can be increased.
Second, an OSA enables one to ascertain whether it is possible to increase the data rate of a fiber span, since it can measure the signals’ spectral width. It is well known that the spectral width of a signal increases as the data rate increases. For example, if 10 Gbits/s channels are displayed in black in figure 7, the data rate can be increased to 40 Gbit/s (shown in red) without affecting the network performance, as long as it is done within the tolerances for chromatic dispersion (CD) and polarization-mode dispersion (PMD). It is important to make sure that the larger spectral width does not make the channels overlap, as this would degrade the BER. As a consequence, a higher data rate leads to more optimal use of the fiber capacity.
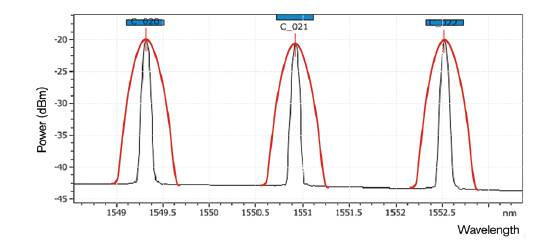
Figure 7. Using an OSA to determine if the data rate can be increased. Channels at 10 Gbit/s are shown in black, while channels at 40 Gbit/s are shown in red.
The third way an OSA can be used to capitalize on a network’s potential is to enable testing of different network configurations in a laboratory environment. Indeed, before roll out, network designers/planners want to assess (in their laboratory) what the impact on the network will be due to the number, position and gain of amplifiers, as well as the location of dispersion compensators, the add or drop of a wavelength by a ROADM, etc. An OSA is the only instrument that gives a global picture of the consequences at the optical level of all these factors, while allowing to identify possible issues or areas of improvements.
Conclusion
An OSA is a powerful measurement device to measure OSNR and qualify a fiber link, as OSNR is directly related to BER. Poor OSNR can adversely affect a network by increasing the number of truck rolls, increasing downtime, etc. In addition, an OSA can be used to fully exploit the capacity of a network by increasing the number of channels, boosting the data rate or testing different network configurations.


